
Altitude filters decide which traffic is allowed into the picture. They are one of the fastest ways to turn a crowded workspace into a readable one.
Use this guide after AO Guide: Choosing TWR/GND, DEP/APP, and ENR Modes. Workspace modes set the operating context. Altitude filters narrow that context to the band of traffic you actually want to study.
In this guide, you will learn how to:
- read the altitude filter control
- set a floor and ceiling
- use surface-to-terminal filters near airports
- use terminal bands to remove ground clutter
- use high-altitude filters for enroute traffic
- use flight-level distribution to choose a useful range
Step 1. Read the altitude filter
The altitude filter shows a CEILING and a FLOOR.
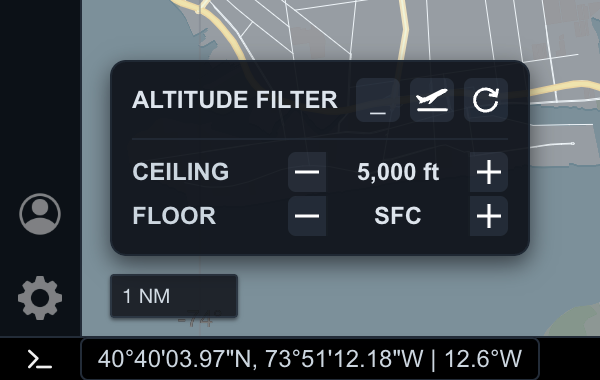
In this example, the ceiling is 5,000 ft and the floor is SFC. AO shows traffic between the surface and 5,000 feet.
Use the minus and plus controls to adjust the range. The floor is the lower bound. The ceiling is the upper bound. Traffic outside that band is hidden from the current view.
The altitude filter does not change the aircraft data. It changes which aircraft are visible in the workspace.
Step 2. Use surface-to-terminal ranges near airports
For airport-local work, start with a surface-based range.
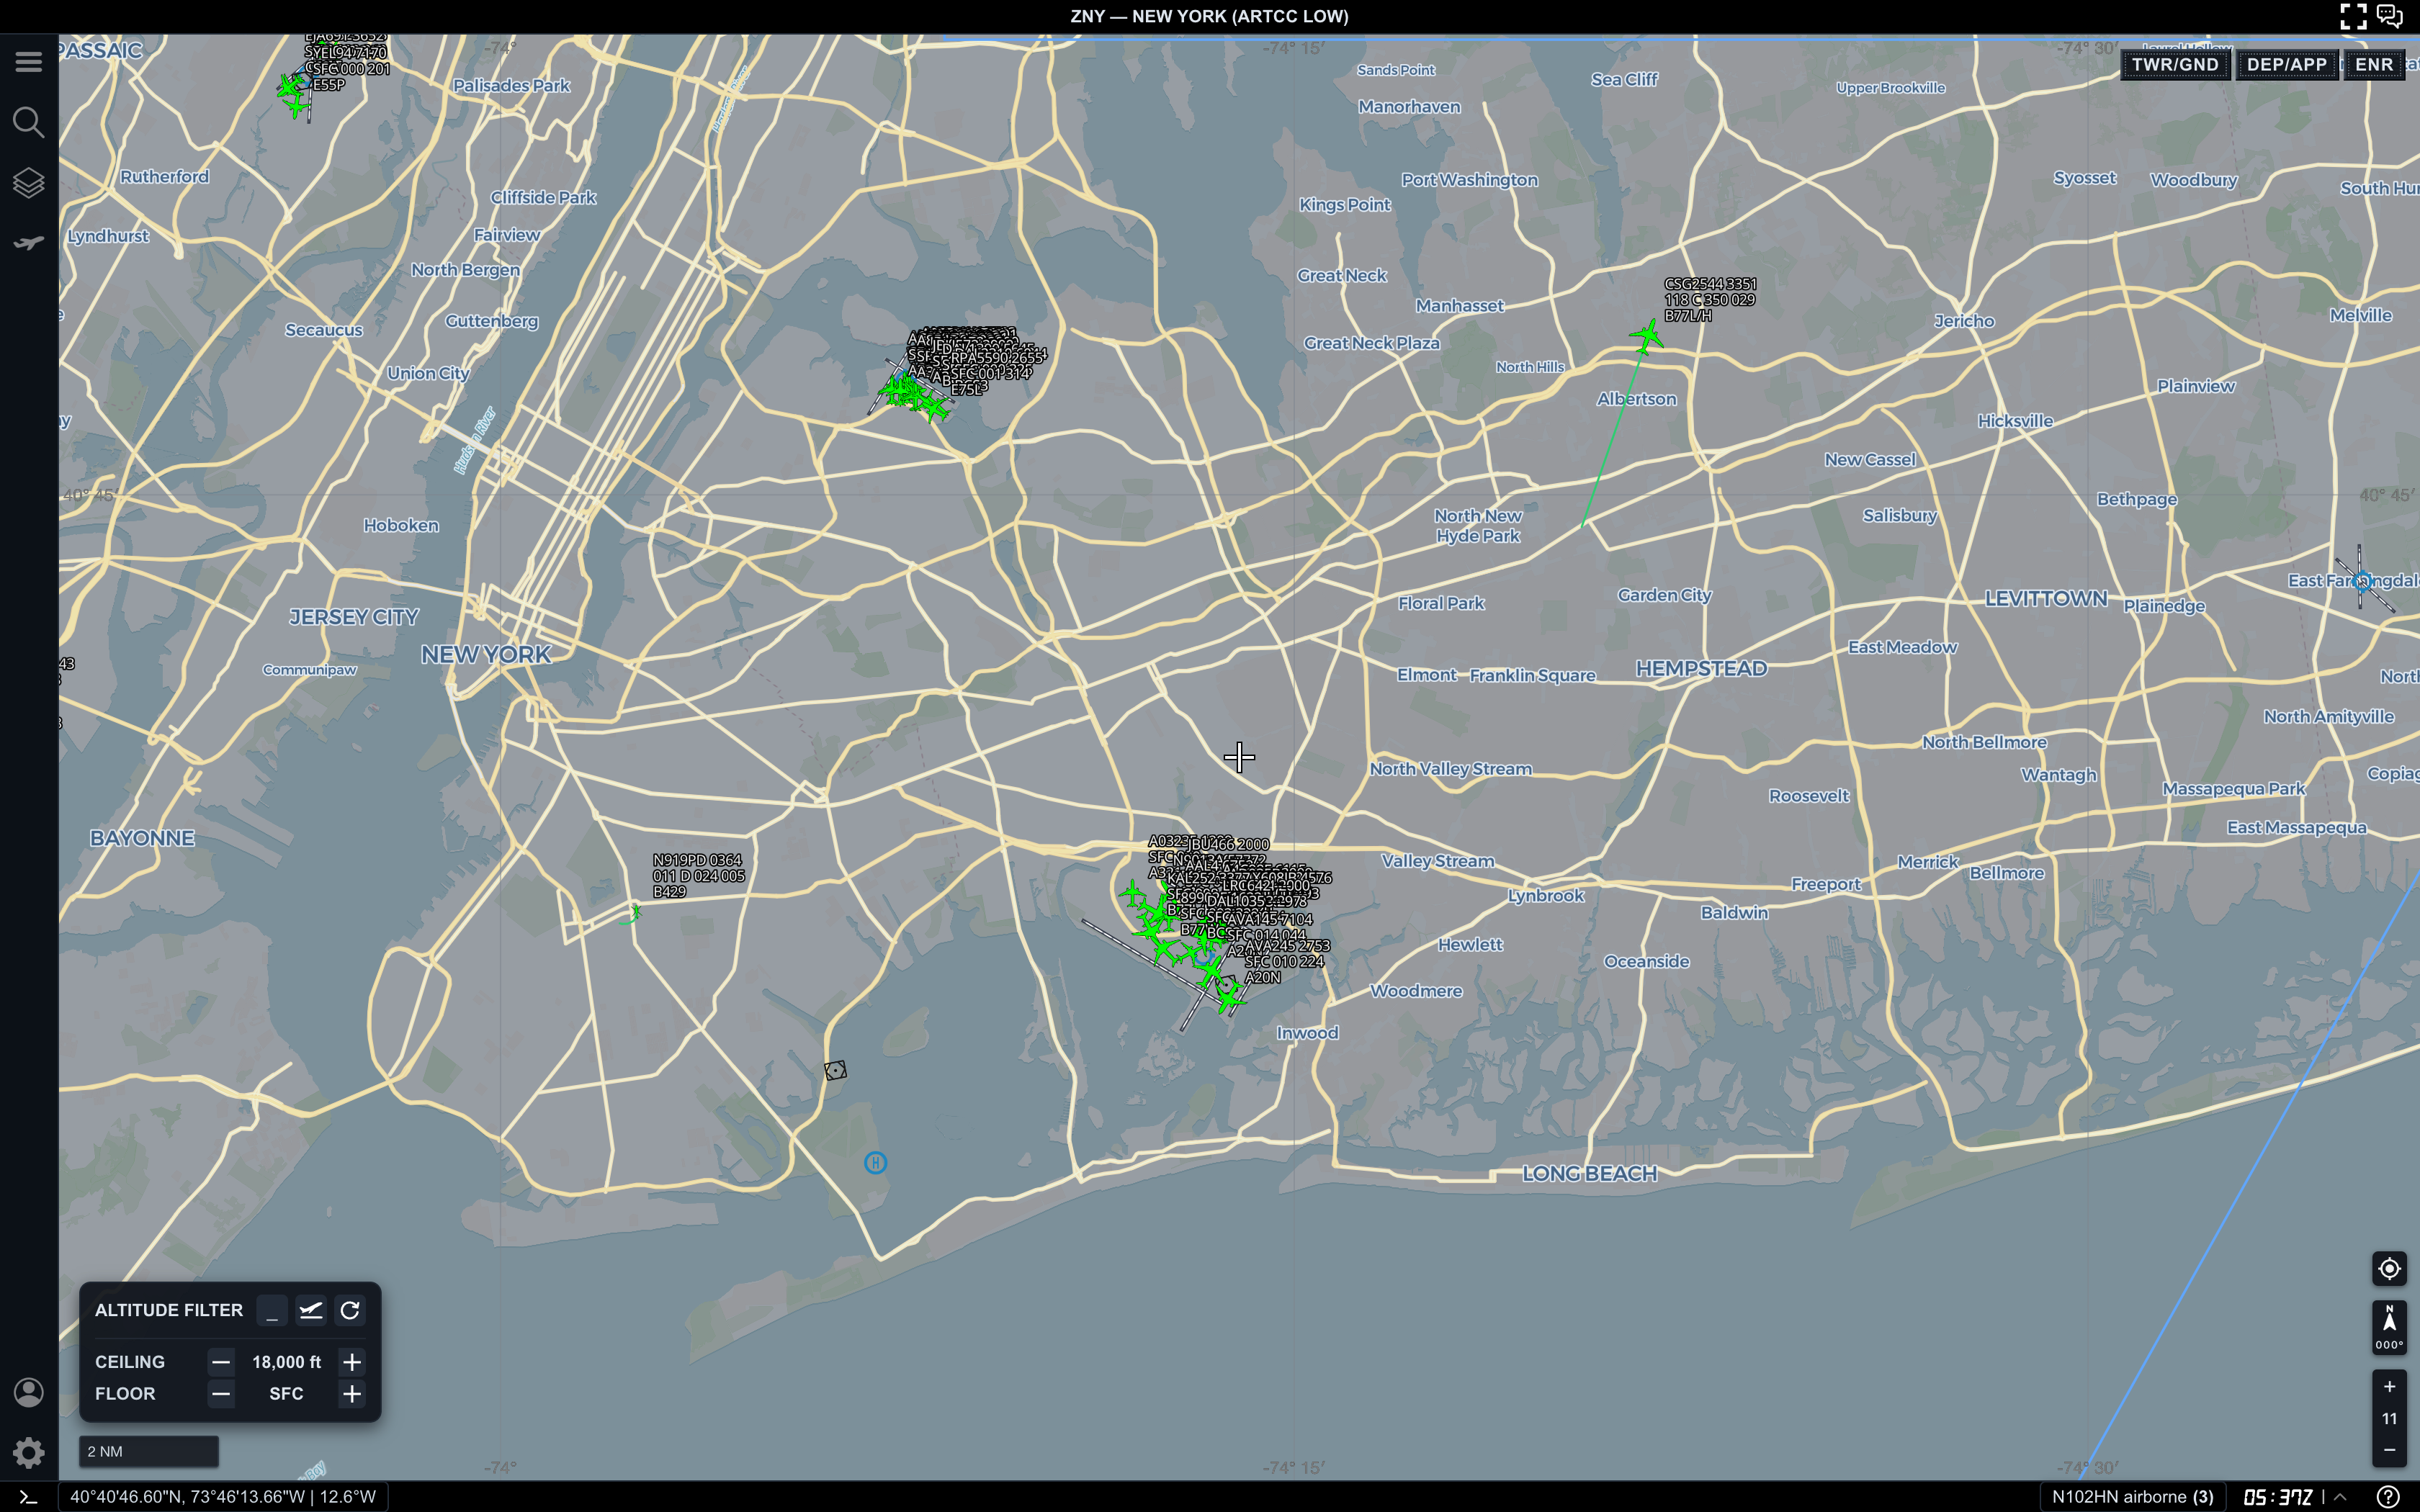
Here, AO is showing traffic from SFC to 18,000 ft. This is broader than a pure ground view, but it is still useful near a major terminal area because it keeps low-altitude aircraft, nearby arrivals, departures, and ground traffic in the same picture.
Use a surface-to-terminal range when you want to:
- keep airport surface traffic visible
- watch aircraft climbing away from the airport
- watch nearby arrivals descending toward the terminal area
- compare ground and low-altitude movement
- avoid jumping immediately into a high-altitude regional view
If the map becomes too crowded, raise the floor or lower the ceiling instead of changing every other setting first.
Step 3. Raise the floor to remove surface clutter
When ground and very low traffic distract from the terminal picture, raise the floor.
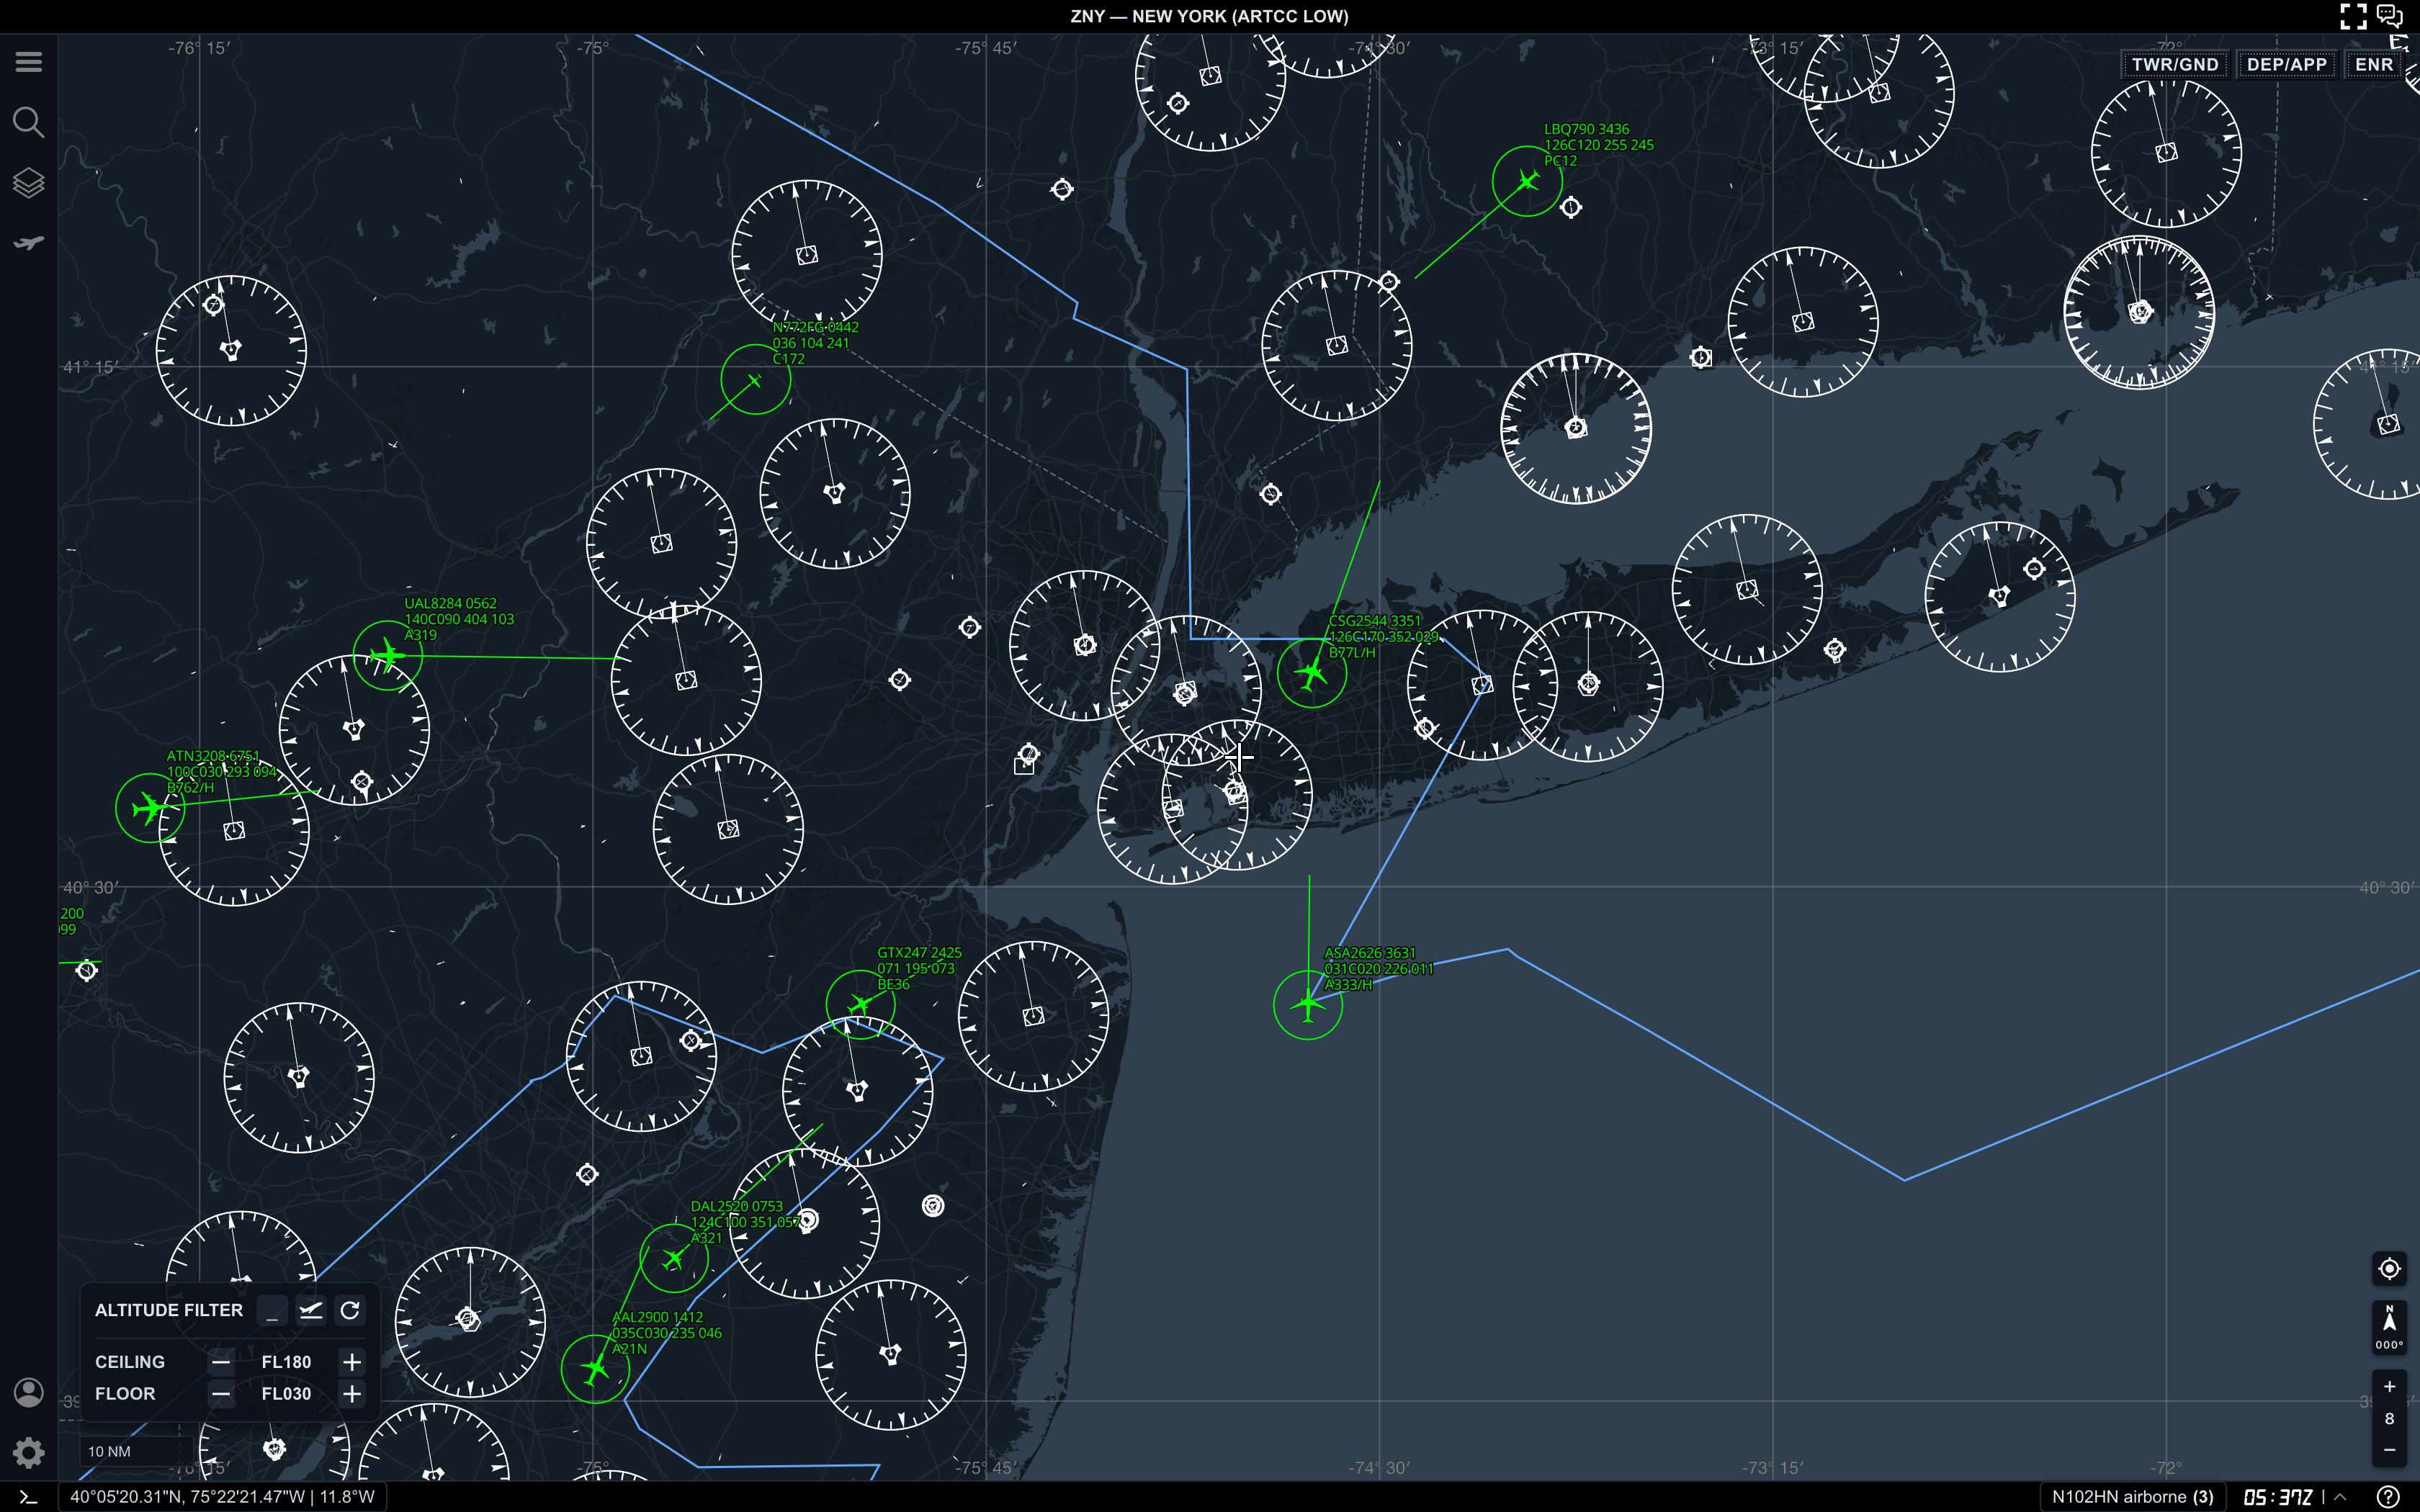
In this view, the filter is set from FL030 to FL180. That removes surface-level traffic and keeps aircraft in a low-to-mid altitude band.
Use this kind of range when you want to:
- compare arrival and departure traffic away from the airport surface
- reduce dense ground labels
- focus on aircraft that are already airborne
- keep terminal traffic visible without including high-altitude cruise traffic
- make Range Calculator measurements easier to read
This is often the most useful band for a DEP/APP workflow.
Step 4. Use high bands for enroute traffic
For regional and high-altitude work, move the filter above terminal altitudes.
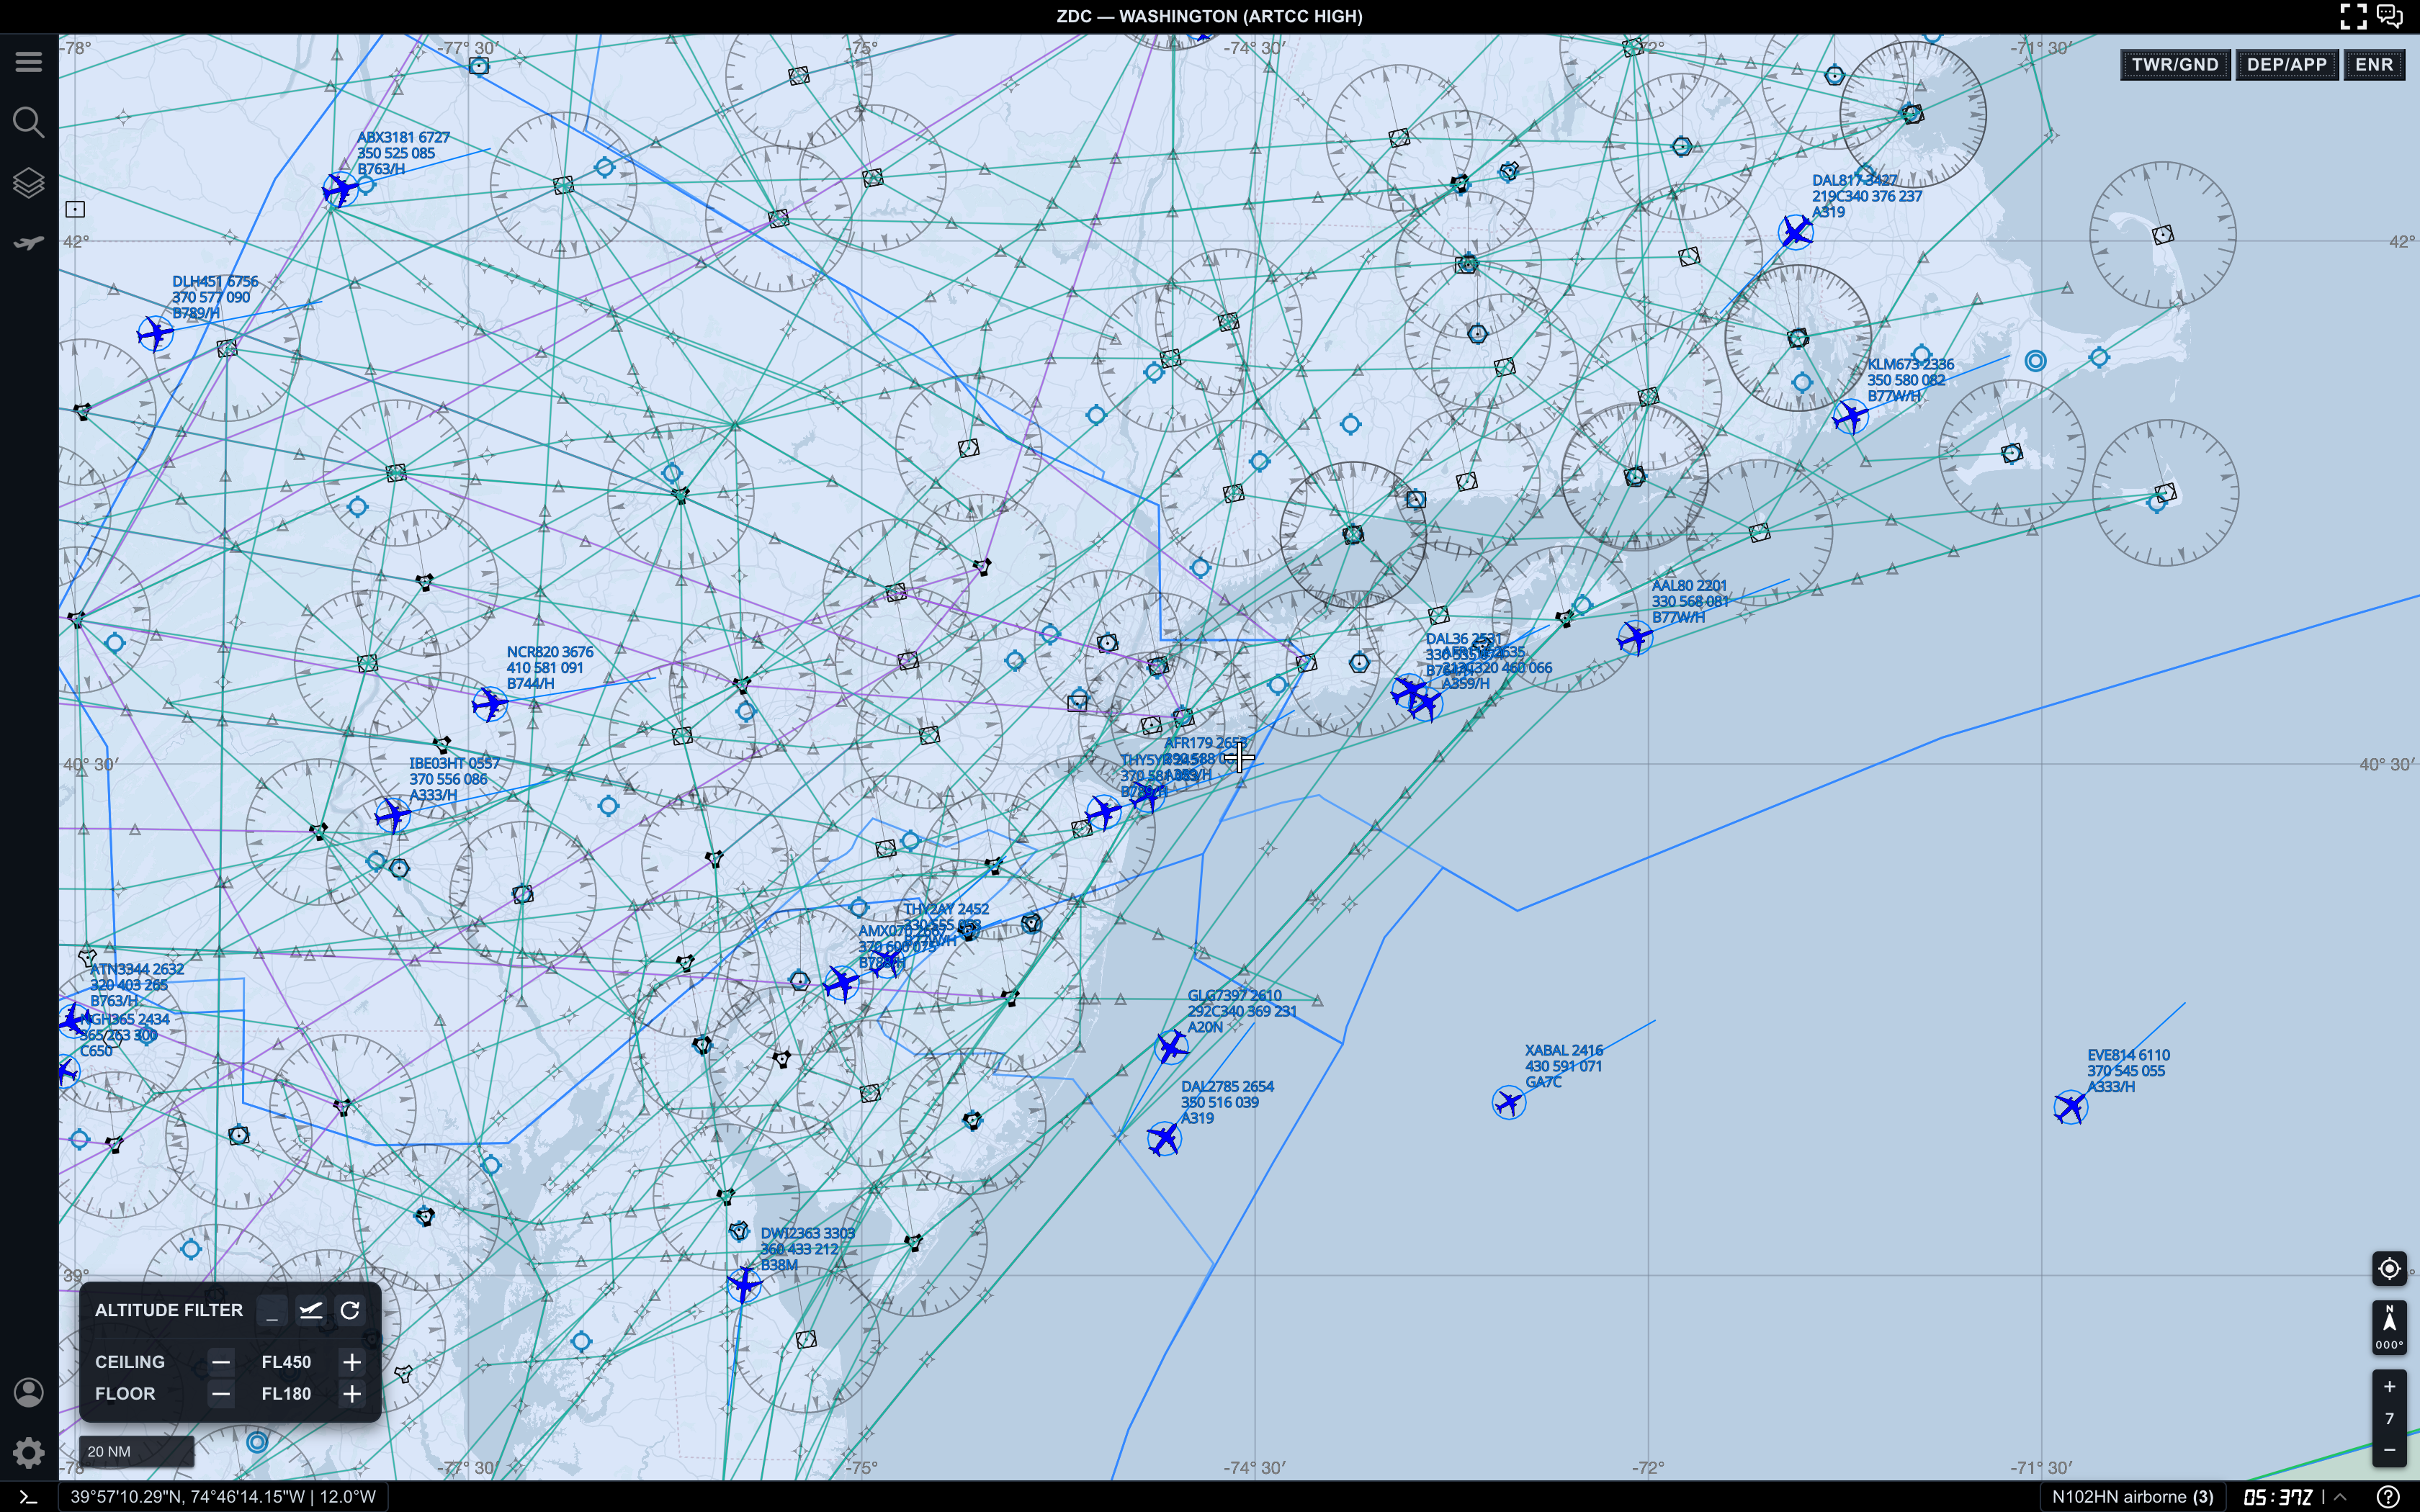
Here, AO is showing traffic from FL180 to FL450. This removes airport-local activity and focuses the map on aircraft moving through the broader enroute structure.
Use this range when you want to:
- study high-altitude traffic flows
- compare aircraft across a larger region
- reduce terminal and surface clutter
- inspect airway and sector context
- measure spacing between enroute targets
If you are looking for a specific aircraft and it disappears, check the aircraft altitude before assuming it left the feed. It may simply be outside the current filter band.
Step 5. Use flight-level distribution as a guide
The flight-level distribution panel helps you see where the current traffic is concentrated.
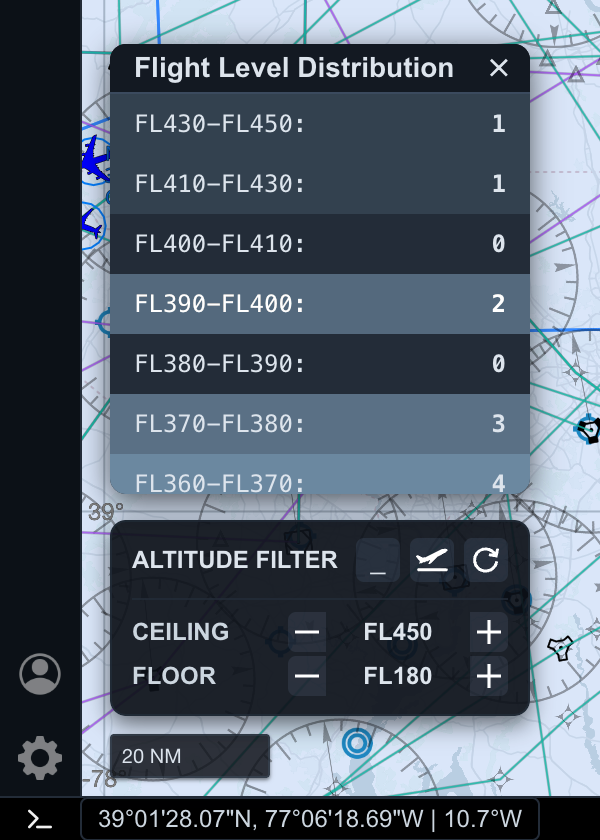
In this example, the filter is set from FL180 to FL450, and AO shows counts across flight-level bands. This gives you a quick sense of whether the selected altitude range is too broad, too narrow, or centered around the traffic you care about.
Use distribution as a guide when:
- high-altitude traffic is too dense
- you want to isolate one cruise band
- you are comparing flows at different levels
- the map looks empty and you need to find where traffic actually is
- you want to pick a better ceiling and floor before measuring
The distribution is a helper, not a rule. Use it to choose a better range, then read the map again.
Practical reading order
When filtering by altitude, use this order:
- Choose the workspace mode first.
- Confirm the altitude filter floor and ceiling.
- Decide whether the visible aircraft match your question.
- Raise the floor to remove lower traffic.
- Lower the ceiling to remove higher traffic.
- Use flight-level distribution when the map is too crowded or too empty.
This keeps the filter tied to the traffic picture instead of becoming a random number adjustment.
Common mistakes
- Forgetting that a hidden aircraft may simply be outside the filter band
- Using
SFCwhen ground traffic is not relevant - Keeping
FL180-FL450active while trying to study terminal traffic - Adjusting zoom before checking the active altitude range
- Treating the filter as a data-quality setting instead of a visibility setting
Next step
After you can shape the traffic picture with altitude filters, continue with AO Guide: Adjusting Target Display Preferences to control label density, trails, prediction lines, and separation circles.